ADOT Collector in EKS: Enhancing Observability in Fargate

Tags

, ,

In the world of Kubernetes and container orchestration, ensuring the efficient monitoring, tracing, and logging of applications is pivotal. For AWS users, particularly those leveraging Amazon Elastic Kubernetes Service (EKS) with AWS Fargate, the AWS Distro for OpenTelemetry (ADOT) plays a crucial role in streamlining these processes. This blog post delves into the importance of the ADOT collector in EKS, spotlighting its implementation as a StatefulSet in Fargate-based systems.

Understanding ADOT

AWS Distro for OpenTelemetry (ADOT) is a secure, production-ready, AWS-supported distribution of the OpenTelemetry project. OpenTelemetry provides open-source APIs, libraries, and agents to collect traces and metrics from your application. You can then send the data to various monitoring tools, including AWS services like Amazon CloudWatch, AWS X-Ray, and third-party tools, for analysis and visualization.

Why ADOT in EKS?

Kubernetes environments, especially those managed through EKS, can become complex, hosting numerous microservices that communicate internally and externally. Tracking every request, error, and transaction across these services without impacting performance is where ADOT shines. It efficiently collects, processes, and exports telemetry data, offering insights into application performance and behavior, thereby enabling developers to maintain high service reliability and performance.

The ADOT Collector as a StatefulSet in AWS Fargate

The deployment of the ADOT collector in EKS can vary based on the underlying infrastructure—Node-based or Fargate. For Fargate-based systems, the configuration manifests a significant divergence, particularly in using StatefulSet over DaemonSet. Here’s why this distinction is crucial.

Fargate: A Serverless Compute Engine

Fargate allows you to run containers without managing servers or clusters. It abstracts the server and cluster management tasks, enabling you to focus on designing and building your applications. This serverless approach, however, means that you don’t have direct control over the nodes running your workloads, differing significantly from a Node-based system where DaemonSet would be ideal for deploying agents like the ADOT collector across all nodes.

Why StatefulSet?

In Fargate, every pod runs on its own isolated environment without sharing the underlying host with other pods. This isolation makes DaemonSet, which is designed to run a copy of a pod on each node in the cluster, incompatible with Fargate’s architecture. Instead, StatefulSet is used to manage the deployment and scaling of a set of Pods and to provide guarantees about the ordering and uniqueness of these Pods. Here’s how the ADOT collector configuration looks when deployed as a StatefulSet:

apiVersion: apps/v1
kind: StatefulSet
metadata:
  name: adot-collector
  namespace: fargate-container-insights
...

This configuration ensures that the ADOT collector runs reliably within the Fargate infrastructure, adhering to the serverless principles while providing the necessary observability features.

Advantages of Using StatefulSet for ADOT in Fargate

  • Isolation and Security: Each instance of the ADOT collector runs in its own isolated environment, enhancing security and reliability.
  • Scalability: Easily scale telemetry collection in tandem with your application without worrying about the underlying infrastructure.
  • Consistent Configuration: StatefulSet ensures that each collector instance is configured identically, simplifying deployment and management.
  • Persistent Storage: If needed, StatefulSet can leverage persistent storage options, ensuring that data is not lost between pod restarts.

Conclusion

Integrating the ADOT collector in EKS as a StatefulSet for Fargate-based systems harmonizes with the serverless nature of Fargate, offering a scalable, secure, and efficient method for telemetry data collection. This setup not only aligns with the modern cloud-native approach to application development but also enhances the observability and operability of applications deployed on AWS, ensuring that developers and operations teams have the insights needed to maintain high performance and reliability.

By leveraging the ADOT collector in this manner, organizations can harness the full power of AWS Fargate’s serverless compute alongside EKS, driving forward the next generation of cloud-native applications with confidence.

Enhancing EKS Observability with Fluent Bit: A Guide to Configuring Logging with ConfigMaps

Tags

, ,

In the realm of Kubernetes, ensuring your clusters are observable and that logs are efficiently managed can be pivotal for understanding the behavior of your applications and for troubleshooting issues. Amazon Elastic Kubernetes Service (EKS) users have a robust tool at their disposal for this purpose: Fluent Bit. This lightweight log processor and forwarder is designed for the cloud, and when configured correctly, can provide deep insights into your applications running on Kubernetes. Today, we’ll dive into setting up Fluent Bit using a Kubernetes ConfigMap to enhance your EKS cluster’s observability.

Introduction to ConfigMaps

Before we delve into the specifics, let’s understand what a ConfigMap is. In Kubernetes, a ConfigMap is a key-value store used to store configuration data. This data can be consumed by pods or used to store configuration files. It’s an ideal way to manage configurations and make them available to your applications without hardcoding them into your application’s code.

Setting Up Fluent Bit for Logging in EKS

The goal here is to configure Fluent Bit to forward logs from your EKS cluster to AWS CloudWatch, allowing you to monitor, store, and access your logs. The configuration involves creating a ConfigMap that Fluent Bit will use to understand where and how to process and forward your logs.

Here’s an overview of the ConfigMap for setting up Fluent Bit for logging:

kind: ConfigMap
apiVersion: v1
metadata:
  name: aws-logging
  namespace: aws-observability
data:
  output.conf: |
    [OUTPUT]
        Name cloudwatch_logs
        Match   *
        region us-east-1
        log_group_name eks/sandbox-cluster
        log_group_template eks/$kubernetes['namespace_name']
        log_stream_prefix pod-logs-
        log_retention_days 15
        auto_create_group true
        log_key log
  parsers.conf: |
    [PARSER]
        Name crio
        Format Regex
        Regex ^(?<time>[^ ]+) (?<stream>stdout|stderr) (?<logtag>P|F) (?<log>.*)$
        Time_Key    time
        Time_Format %Y-%m-%dT%H:%M:%S.%L%z
  filters.conf: |
    [FILTER]
        Name parser
        Match *
        Key_name log
        Parser crio

    [FILTER]
        Name             kubernetes
        Match            kube.*
        Kube_Tag_Prefix  kube.var.log.containers.
        Merge_Log        On
        Merge_Log_Key    log_processed

Understanding the Configuration

  • Metadata: The metadata section names our ConfigMap aws-logging and places it within the aws-observability namespace.
  • Data: Contains the configurations for Fluent Bit’s operation. It’s divided into three parts:
  • output.conf: Defines how logs are forwarded to AWS CloudWatch. It specifies the log group name, region, retention policies, and more.
  • parsers.conf: Contains parser definitions that help Fluent Bit understand the format of your logs. The example provided uses a regex parser for logs coming from crio (a lightweight container runtime).
  • filters.conf: Filters allow Fluent Bit to process the logs before forwarding them. The provided configuration parses logs and enriches them with Kubernetes metadata.

Applying the ConfigMap

To apply this ConfigMap to your EKS cluster, save the YAML to a file and use kubectl apply -f <filename.yaml>. This command instructs Kubernetes to create the ConfigMap based on your file. After applying, Fluent Bit will use this configuration to process and forward logs from your cluster to AWS CloudWatch.

Conclusion

Setting up Fluent Bit with a properly configured ConfigMap can significantly enhance the observability of your EKS clusters. By leveraging AWS CloudWatch, you gain a powerful tool for log management and analysis, helping you keep your applications healthy and performant. Remember, the key to effective Kubernetes management lies in understanding the tools at your disposal and configuring them to meet your specific needs.

Creating AWS CloudWatch Alarm using Lambda function

Tags

, , , , ,

As part of our journey towards achieving SOC2 compliance, one of the critical steps we undertook was ensuring the health and performance of our Elastic Load Balancers (ELB) by monitoring their associated target groups. SOC2 compliance is pivotal for us, emphasizing the need to manage and safeguard our customer data effectively.

Normally if you use EKS in combination with a configuration based deployment solutions like we do, then we do not have control over targetgroup names and generated arn. So I decided to automate the configuration of alarms on targetgroup metrics using AWS EventBridge and Lambda.

We are primarily interested when a targetgroup has new targets registered. So we setup an eventbridge rule to generate an event when an ELB has RegisterTarget event generated.

In this blog post, I’ll guide you through the process of setting up AWS CloudWatch alarms for ELB Target Groups using EventBridge and a Lambda function, a task that was essential in our compliance efforts.

Understanding the Need

SOC2 compliance requires stringent monitoring of various aspects of your cloud infrastructure. For our use case, monitoring the health of the ELB Target Groups was crucial. A target group’s health directly impacts the performance and availability of the applications it serves. By setting up alarms, we can be alerted to any issues in real-time, allowing for immediate action to remediate potential problems, thereby ensuring continuous compliance with SOC2’s availability and performance criteria.

The Implementation Journey

The implementation involved three primary components: AWS EventBridge, AWS Lambda, and AWS CloudWatch Alarms. Here’s a step-by-step overview of the process:

1. Setting Up an SNS Topic

First, you’ll need an SNS topic for alarm notifications. This allows you to be promptly alerted when an alarm state is reached.

  1. Navigate to the Amazon SNS dashboard in the AWS Management Console.
  2. Click on “Topics” then “Create topic”.
  3. Choose “Standard” as the type and give your topic a name, such as Prod_CloudWatch_Alarms_Topic.
  4. Click “Create topic”.
  5. Once the topic is created, create a subscription to get notifications. Click on the topic, then “Create subscription”.
  6. Choose a protocol (e.g., Email) and specify the endpoint (e.g., your email address).
  7. Click “Create subscription”. You will receive a confirmation email. Confirm your subscription.

2. EventBridge Rule Setup

We started by setting up an EventBridge rule to trigger on specific events related to our ELB Target Groups. The rule was configured to listen for RegisterTargets events, a common action that could impact the health and performance of our target groups.

To trigger your Lambda function in response to specific ELB actions:

  1. Go to the Amazon EventBridge console and select “Create rule”.
  2. Name your rule and define the event pattern as provided in your initial query.
  3. In the Target section, select Lambda function, and choose the function you created.
  4. Click “Create”.

The rule pattern used was as follows:

{
  "source": ["aws.elasticloadbalancing"],
  "detail-type": ["AWS API Call via CloudTrail"],
  "detail": {
    "eventSource": ["elasticloadbalancing.amazonaws.com"],
    "eventName": ["RegisterTargets"]
  }
}

This rule ensures that any time targets are registered (or deregistered) with our target groups, our Lambda function would be invoked to assess and possibly adjust our monitoring setup accordingly.

3. Lambda Function for Dynamic Alarm Management

Your Lambda function will respond to ELB events and manage CloudWatch alarms.

Create Your Lambda Function

  1. Navigate to the AWS Lambda dashboard and click “Create function”.
  2. Choose “Author from scratch”, give your function a name, and select Node.js as the runtime.
  3. Create or choose an existing role with permissions for CloudWatch and ELB access.
  4. Click “Create function”.

package.json configuration

Your lambda-function directory should contain a package.json file with the following content:

{
  "name": "lambda-function",
  "version": "1.0.0",
  "description": "AWS Lambda function to manage CloudWatch alarms for Target Groups.",
  "type": "module",
  "main": "index.js",
  "scripts": {
    "start": "node index.js"
  },
  "dependencies": {
    "@aws-sdk/client-cloudwatch": "^3.0.0",
    "@aws-sdk/client-elastic-load-balancing-v2": "^3.0.0",
    "@aws-sdk/client-ssm": "^3.0.0"
  }
}

Our Lambda function, written in Node.js, plays a pivotal role in this setup. It dynamically creates or updates CloudWatch alarms based on the events received from EventBridge. This approach ensures that our alarms are always in sync with the current state of our target groups and load balancers.

The function performs the following actions:

  • Extracts the target group ARN from the event and uses it to retrieve the associated load balancer information.
  • Constructs the alarm parameters, focusing on the UnHealthyHostCount metric, which is critical for understanding the health of our target groups.
  • Uses the AWS SDK for JavaScript (v3) to interact with CloudWatch and create/update the necessary alarms.

index.mjs configuration

Below is a snippet from our Lambda function showing how we construct the CloudWatch alarm:

import { CloudWatchClient, PutMetricAlarmCommand } from "@aws-sdk/client-cloudwatch";
import pkg from '@aws-sdk/client-elastic-load-balancing-v2';
const { ElasticLoadBalancingV2Client, DescribeTargetGroupsCommand } = pkg;

const cloudWatchClient = new CloudWatchClient({ region: "us-east-1" });
const elbv2Client = new ElasticLoadBalancingV2Client({ region: "us-east-1" });

export const handler = async (event) => {
    console.log("Event: ", event);

    try {
        const targetGroupARN = event.detail.requestParameters.targetGroupArn;
        // Extracting the Target Group name (tgName) directly from ARN might not be straightforward as the ARN format
        // might be different. Make sure to adjust the extraction logic based on the actual ARN format you receive.
        const tgName = targetGroupARN.split(':').pop();
        const describeTGCommand = new DescribeTargetGroupsCommand({ TargetGroupArns: [targetGroupARN] });
        const tgResponse = await elbv2Client.send(describeTGCommand);

        if (!tgResponse.TargetGroups || tgResponse.TargetGroups.length === 0) {
            console.log('No Target Groups found.');
            return;
        }

        const loadBalancerArns = tgResponse.TargetGroups[0].LoadBalancerArns;
        if (!loadBalancerArns || loadBalancerArns.length === 0) {
            console.log('No Load Balancers associated with the Target Group.');
            return;
        }

        // Extracting Load Balancer name from ARN might require similar attention to the extraction logic.
        const loadBalancerArn = loadBalancerArns[0];
        var lbName = loadBalancerArn.split(':').pop();
        lbName = lbName.replace('loadbalancer/','');
        
        console.log('LoadBlanacer Id : ' + lbName);

        const alarmParams = {
            AlarmName: `UnhealthyHostCount-${tgName}`,
            ComparisonOperator: 'GreaterThanThreshold',
            EvaluationPeriods: 1,
            MetricName: 'UnHealthyHostCount',
            Namespace: 'AWS/ApplicationELB',
            Period: 300,
            Statistic: 'Average',
            Threshold: 1,
            ActionsEnabled: true,
            AlarmActions: ['arn:aws:sns:us-east-1:123456789:Prod_CloudWatch_Alarms_Topic'], 
            AlarmDescription: 'Alarm when UnhealthyHostCount is above 1',
            Dimensions: [
                {
                    Name: 'TargetGroup',
                    Value: tgName
                },
                {
                    Name: 'LoadBalancer',
                    Value: lbName
                }
            ],
        };

        const putAlarmCommand = new PutMetricAlarmCommand(alarmParams);
        const alarmData = await cloudWatchClient.send(putAlarmCommand);
        console.log("Alarm created/updated: ", alarmData);
    } catch (err) {
        console.error("Error in processing: ", err);
    }
};

4. Deploy Your Lambda Function

Now, deploy your Lambda function by uploading the code through the AWS Management Console or using AWS CLI. Make sure your index.mjs and package.json are included in the deployment package.

5. Testing and Validation

After setting everything up, it’s crucial to test your configuration:

  • Trigger a target group change event (e.g., register or deregister targets).
  • Verify that your Lambda function executed correctly in the Lambda console’s Monitoring tab.
  • Check that the corresponding CloudWatch alarm is created or updated in the CloudWatch console.
  • Ensure that you receive a notification through your SNS topic subscription.

Conclusion

Following these steps, you’ve created a robust monitoring solution for your ELB Target Groups, aligning with SOC2 compliance requirements. This setup not only helps in proactive issue resolution but also in maintaining the high availability and performance of your applications, crucial for SOC2’s focus on security and availability.

Mulesoft : Create Cloudhub Notification

Tags

, , , , ,

We need different types of nontifications when creating an integration application using Mule or any other technology. We can of course use something like email or SMTP or any other specific API, but that ties the code strongly to the implementation. A better option is to use Mule Cloudhub’s Notifications which can generate different types of alerts with lot of details and also send email if required.

There are of course 2 parts to the solution –

A) Configuration and Setup in CloudHub

Follow instructions here to setup alert in CloudHub. These instructions work well, so I won’t repeat those.

B) Configuration and coding in Anypoint Studio

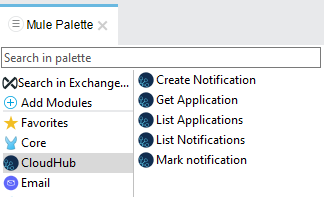
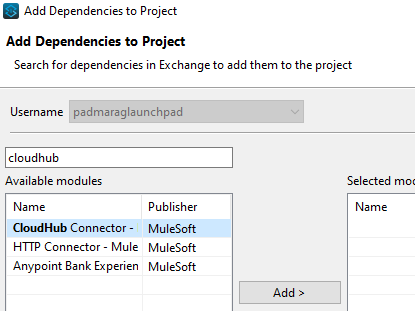
      1. Add Cloudhub Connector to your application. If you do not find it, download it from exchange inside your studio.
        1
      2. In your error handler flow, add a Cloudhub Create Notification component.
        2
      3. You may need to define a Cloudhub Configuration, Use your cloudhub username, password and environment details to do this.
      4. Now in the code open the file in XML, you can do this using the visual UI as well, but I prefer this in XML.
      5. Create a subflow to handle actual notifications
        3
        You can add any number of custom properties and then refer to them when creating your notification in CloudHub
      6. Call the subflow from your error handler section
        4


Create docker secret for Amazon ECR in Kubernetes using Java Client

Tags

, ,

It’s quite easy to use dockerhub with kubernetes deployments. Unfortunately that’s not the case if you want to use Amazon ECR as your container repository.

Amazon ECR has a few quirks before you can use it in your kubernetes platform. Amazon ECR does not allow you to use the API keys directly to create images. You need to generate a token to be used with ECR & the token is valid only for 12 hours.

Before you begin, please add below dependencies to your maven project.


<dependency>
	<groupId>com.github.docker-java</groupId>
	<artifactId>docker-java</artifactId>
	<version>3.0.14</version>
</dependency>

<dependency>
	<groupId>io.kubernetes</groupId>
	<artifactId>client-java</artifactId>
	<version>4.0.0-beta1</version>
</dependency>

<dependency>
	<groupId>com.amazonaws</groupId>
	<artifactId>aws-java-sdk-ecr</artifactId>
	<version>1.11.477</version>
</dependency>

There are 2 main parts in using Amazon ECR with Docker & Kubernetes –
I) Push Docker Image to Amazon ECR

  1. Create Amazon ECR Authorization Token
    
        @Value("${aws.ecr.access.key}")
        private String accessKey;
    
        @Value("${aws.ecr.access.secret}")
        private String accessSecret;
    
        @Value("${aws.ecr.default.region}")
        private String region;
    
        @Override
        public AuthorizationData getECRAuthorizationData(String repositoryName) {
    
            //Create AWS Credentials using Access Key
            AWSCredentials awsCredentials = new BasicAWSCredentials(accessKey, accessSecret);
    
            //Create AWS ECR Client
            AmazonECR amazonECR = AmazonECRClientBuilder.standard()
                    .withRegion(region)
                    .withCredentials(new AWSStaticCredentialsProvider(awsCredentials))
                    .build();
    
            Repository repository = null;
            //Describe Repos. Check if repo exists for given repository name
            try {
                DescribeRepositoriesRequest describeRepositoriesRequest = new DescribeRepositoriesRequest();
                List listOfRepos = new ArrayList();
                listOfRepos.add(repositoryName);
                describeRepositoriesRequest.setRepositoryNames(listOfRepos);
                DescribeRepositoriesResult describeRepositoriesResult = amazonECR.describeRepositories(describeRepositoriesRequest);
    
                List repositories = describeRepositoriesResult.getRepositories();
                repository = repositories.get(0);
    
            }catch(Exception e){
                System.out.println("Error fetching repo. Error is : " + e.getMessage());
                System.out.println("Creating repo....");
                //Create Repository if required
                CreateRepositoryRequest createRepositoryRequest = new CreateRepositoryRequest().withRepositoryName(repositoryName);
                CreateRepositoryResult createRepositoryResult = amazonECR.createRepository(createRepositoryRequest);
                System.out.println("Created new repository : " + createRepositoryResult.getRepository().getRegistryId());
                repository = createRepositoryResult.getRepository();
            }
    		
    	    //Get Auth Token for Repository using it's registry Id
            GetAuthorizationTokenResult authorizationToken = amazonECR
                    .getAuthorizationToken(new GetAuthorizationTokenRequest().withRegistryIds(repository.getRegistryId()));
    
            List authorizationData = authorizationToken.getAuthorizationData();
            return authorizationData.get(0);
    
        }
    
    
  2. Use token in docker java client
    
            String userPassword = StringUtils.newStringUtf8(Base64.decodeBase64(authData.getAuthorizationToken()));
            String user = userPassword.substring(0, userPassword.indexOf(":"));
            String password = userPassword.substring(userPassword.indexOf(":") + 1);
    
            System.out.println("ECR Endpoint : " + authData.getProxyEndpoint());
    
            //Create Docker Config
            DockerClientConfig config = DefaultDockerClientConfig.createDefaultConfigBuilder()
                    .withDockerHost(dockerUrl)
                    .withDockerTlsVerify(false)
                    .withRegistryUrl(authData.getProxyEndpoint())
                    .withRegistryUsername(user)
                    .withRegistryPassword(password)
                    .withRegistryEmail("padmarag.lokhande@golaunchpad.io")
                    .build();
            DockerClient docker = DockerClientBuilder.getInstance(config).build();
    
  3. Build Docker image
    		
    		String imageId = docker.buildImageCmd()
                            .withDockerfile(new File(params.getFilePath() + "\\Dockerfile"))
                            .withPull(true)
                            .withNoCache(true)
                            .withTag("latest")
                            .exec(new BuildImageResultCallback())
                            .awaitImageId();
    
  4. Tag Docker image
    						
    		String tag = "latest";
            String repository = authData.getProxyEndpoint().replaceFirst("https://", org.apache.commons.lang.StringUtils.EMPTY) + "/" + params.getApplicationName();
    		
    		TagImageCmd tagImageCmd = docker.tagImageCmd(imageId, repository, tag);
            tagImageCmd.exec();
    
    
  5. Push Docker image to Amazon ECR
            
            docker.pushImageCmd(repository)
                  .withTag("latest")
                  .exec(new PushImageResultCallback())
                  .awaitCompletion(600, TimeUnit.SECONDS);


II) Pull Docker Image from ECR into Kubernetes

  1. Create Secret in Kubernetes
  2. First we need to create Kubernetes config using kubernetes api server url and token for admin account.

    
    ApiClient client = Config.fromToken(master, token,false);
    String userPassword = org.apache.commons.codec.binary.StringUtils.newStringUtf8(Base64.decodeBase64(ecrAuthorizationData.getAuthorizationToken()));
    String user = userPassword.substring(0, userPassword.indexOf(":"));
    String password = userPassword.substring(userPassword.indexOf(":") + 1);


    This is one important difference between normal kubernetes secret and special docker ecr secret. Check the type “kubernetes.io/dockerconfigjson”

    
    V1Secret newSecret = new V1SecretBuilder()
                        .withNewMetadata()
                        .withName(ECR_REGISTRY)
                        .withNamespace(params.getNamespace())
                        .endMetadata()
                        .withType("kubernetes.io/dockerconfigjson")
                        .build();
    
    newSecret.setType("kubernetes.io/dockerconfigjson");
    

    The content for kubernetes docker secret needs to be created in specifically formatted json using data as set below. This is then set as byte data in V1Secret.

    
    HashMap secretData = new HashMap(1);
    String dockerCfg = String.format("{\"auths\": {\"%s\": {\"username\": \"%s\",\t\"password\": \"%s\",\"email\": \"%s\",\t\"auth\": \"%s\"}}}",
            ecrAuthorizationData.getProxyEndpoint(),
            user,
            password,
            "padmarag.lokhande@golaunchpad.io",
            ecrAuthorizationData.getAuthorizationToken());
    
    Map data = new HashMap();
    data.put(".dockerconfigjson",dockerCfg.getBytes());
    newSecret.setData(data);
    
    V1Secret namespacedSecret = api.createNamespacedSecret(params.getNamespace(), newSecret, true, params.getPretty(), params.getDryRun());
    

Zapier – Beyond the basics – Part II : POST data to an external API

Tags

In the last blog, I explained how it is possible to make custom calls to external API’s to fetch data. In this blog I’ll show how you can post data to an external API via a POST action.

First we add a “Code by Zapier” step as usual and then map required inputs. refer to my last blog for details.

Next we go the the actual ode section and add something like this :


var line_amount = parseFloat(inputData.line_amount);
var tax_amount = parseFloat(inputData.tax_amount);
var customer_id = Number(inputData.customer_id);

console.log("line_amount : " + line_amount + ", tax_amount : " + tax_amount + " , customer_id : " + customer_id);

var invoice =
{
"Line": [{
"Description": inputData.description,
"Amount": line_amount,
"DetailType": "SalesItemLineDetail",
"SalesItemLineDetail": {
"ItemRef": {
"value": "3",
"name": "Product"
},
"UnitPrice": line_amount,
"Qty": 1,
"TaxCodeRef": {
"value": inputData.tax_code
}
}
}],
"TxnTaxDetail": {
"TxnTaxCodeRef": {
"value": "3"
},
"TotalTax": tax_amount,
"TaxLine": [{
"Amount": tax_amount,
"DetailType": "TaxLineDetail",
"TaxLineDetail": {
"TaxRateRef": {
"value": "3"
},
"NetAmountTaxable": line_amount
}
}]
},
"CustomerRef": {
"value": customer_id,
"name": inputData.customer_name
}
}

console.log("Invoice :" + JSON.stringify(invoice));

var options = {
headers:{
"Authorization": "Bearer " + inputData.access_token,
"Accept":"application/json",
"Content-Type":"application/json"
},
method : "POST",
body : JSON.stringify(invoice)

};

fetch('https://quickbooks.api.intuit.com/v3/company/123123123/invoice',options)
.then(function(res) {
console.log("response : " + res);
return res.json();
})
.then(function(json) {
var output = [{error: json.Fault, invoice:invoice, response:json}];
callback(null, output);
})
.catch(callback);

The important part to focus is the “options” passed in to fetch command where we specify the POST method, Headers and the JSON.stringify for body payload when body is of type JSON as is in the above case.

Lastly, Zapier uses fetch which uses a promise based design to process results, so we have the bunch of action->then->then code.

Enjoy!

Zapier – Beyond the basics – Part I : Fetching data from external API

Tags

, ,

Zapier is an excellent tool for Integration for Small and Medium Business. It fills 80% of the needs for most of the scenarios.

However there are a few scenarios which require you to go out of the box that zapier provides. One such scenario is interacting with an API which is not available in Zapier or which has exposed only limited operations in their official Zapier App.

Thankfully Zapier has provided the tools to do so. In these series of posts, I’ll be covering some common use-cases for Zapier.

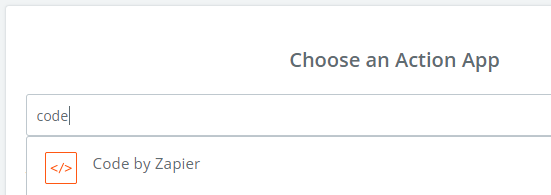
The primary tool or component for interacting with external API is the “Code by Zapier” component.

You can add this as an Action step.

1

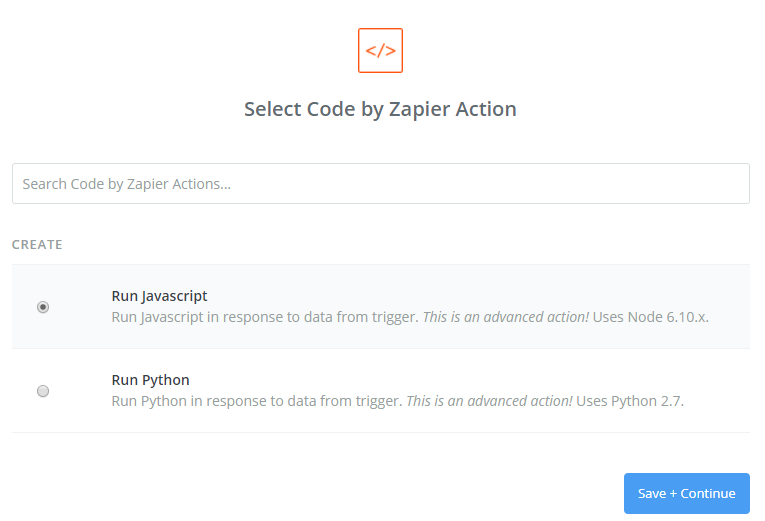
I typically choose “Javascript” which is essentially Node JS.

2

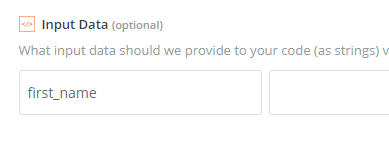
Any data from other steps that you want to pass in can be added here and it’ll be available under “inputData” object. So if you add a property “first_name” then it’ll be available in code as “inputData.first_name”

3

And under the code section, you can include your actual code like

fetch('http://example.com/')
  .then(function(res) {
    return res.json();
  })
  .then(function(json) {
    var output = {id: 1234, response: json};
    callback(null, output);
  })
  .catch(callback);

Zapier uses Node Fetch module to get data. It is a promise based library and requires some then, callback logic.

This is a simple example to call “GET” operation on any API. If you need to pass some headers, do it as :

var options = {
 headers:{
 "Authorization": "Basic Abcdesjjfjfj="
 } 
};
fetch('https://us2.api.mailchimp.com/3.0/campaigns/1a2s3d/content',options) 
    .then(function(res) {
        return res.json();
    })
    .then(function(json) {
        var html_content = json.archive_html;
        var output = {"content":html_content}; 
        callback(null, output);
    })
 .catch(callback);

In the next posts, we’ll go into some more complex scenarios including use of OAuth based API and POST using Zapier.

Which SOA Suite is correct for me? – Part 1

Tags

, , ,

This will be a series of multiple posts to answer the question. I’ll review both commercial as well as Open Source SOA/ESB’s to answer the question.
I’ll cover a simple typical scenario – yes the done to death PO approval 🙂

SOA Suites –
1) Oracle SOA Suite 12c
2) MuleESB
3) JBOSS SOA
4) WSO2 SOA
5) Apache (Camel, Drools, ActiveMQ)
6) FuseESB

Scenario –
1) Read PO XML from file(CSV)
2) Transform & Call WS with Canonical Interface
3) Run Business Rules to check if Approval requried
4) Send by FTP

Features –
1) Development effort & IDE
2) Deployment
3) Monitoring & Alerts
4) SOA Governance

Importance of understanding your database

Recently I was working on an integration project where the database used was MS SQL server and the integration platform was Oracle SOA Suite.

The service itself was quite simple – to fetch some data from SQL server and Enqueue it on JMS queue. We used DB Adapter for polling the database. We used the Delete strategy and the service was distributed on a cluster.

Once the ids were enqueued, there was a seperate EJB-based webservice which queried same database to create the canonical. We have used JPA Entity Beans for ORM. There is a particular query to get some extra information from a table which does not have foreign-key relation. The query used a single parameter – a string.

However we observed a huge performance issue for SQL server as well as the website hosted on the database. We observed 99% CPU usage.

It was our SQL DBA who found out the issue. The column in database was varchar, the index was based on same. However, the query parameter that got sent to the database was using nvarchar. This caused a full table scan and completely skipped the index.

The solution use “sendStringParametersAsUnicode” property of Weblogic SQL Server driver. By default everything gets sent as Unicode from JDBC Driver, using “sendStringParametersAsUnicode=false”, we made the driver send the parameter as varchar and immediately saw the difference. CPU usage was down to 1%.

This underscores the point that Frameworks and Engines abstract out a lot of features, but it is necessary to understand you database to make optimal use of it.

Reference – http://msdn.microsoft.com/en-us/library/ms378988.aspx

Generic Architecture for Cloud Apps Integration : Integrate multiple apps using JMS Publish – Subscribe

With the advent of cloud, the trend is to use cloud-based best of breed software for different needs. Although this provides very good and deep functionality, it also opens up a lot of issues related to data management and integrity.

A very common scenario nowadays is to use SaaS application like Salesforce or SugarCRM for CRM. Then to use SaaS ERP like NetSuite or on-premise ERP. There could also be Quickbooks used for accounting. Besides these there are the HelpDesk apps.

All of these applications have their own internal databases, schemas and representation of your data. A change in one place needs to be reflected in other apps as well. This results in lot of difficulties on how to integrate the apps. Conventional star topology or app-to-app integration fall short.

This is where a Messaging Oriented Middleware (MOM) solution like ESB is very useful. I am presenting a generic architecture for multiple apps to apps integration.

Brief explanation of components in the proposed architecure –

  • Purchase Order – This is the input document that comes to the system. We generally need to update multiple systems based on the docuemnt. The format could be cXML or any custom XML schema. It could be transformed into a standard or canonical format accepted internally.
  • ActiveMQ JMS – The document is put on Topic of any messaging application. I have assumed ActiveMQ here, but it could be any MQ system that supports publish-subscribe model.
  • Transformers – We have 3 subscribers to this Topic, however each of them accepts different formats. To compensate for this, we have a trasnfromer for each of the subscriber. e.g., the PO to CRM transformer could transform the message from CXML format to SalesForce.com Schema.
  • Subscribers – All 3 subscribers receive the message document and update their respective system with the data.